This Fall, John Mohr and I ran a pilot program to teach Sociology undergraduates how to use topic modeling in courese projects. The pilot program lasted 4 weeks and students were asked to prepare a text corpus of approximately 100 documents using LexisNexis (or copy-paste from the web) and perform analysis using Excel or Google Sheets. Past mentoring projects of both John and I showed that undergraduates can come up with some pretty creative ways to use these computational analysis tools, even if they can’’’t write the code to do it themselves.
Beyond the technical, the most challenging part of this work is getting students to think about what information they can get from large corpora and how to use the tools to answer questions of interest. It is clear that the era of Big Data and access to internet has changed the way social processes occur on a large scale (think Fake News), so we need to train social scientists to use new tools and think about data differently.
Researchers like John and I are excited about the new questions we can answer about these tools, but I’ve been realizing that it’s not so easy to explain how to analyze 100 documents using algorithms that to them are ‘black boxes’. Part of this involves the emphasis on a loose coupling between theory and method, and part of it relates to theorizing about the media being analyzed. I’m thinking that few undergraduates are immediately prepared to study news corpora because it’’‘s not something students are used to exploring manually as ’close readers’. Additionally, there are technical challenges like construction of corpus and use of Excel that add curvature to the learning barrier.
Our approach was to have students create a corpus of interest using LexisNexis, send it to me so I could output a topic model as a spreadsheet, then use Excel to aid in qualitative analysis and generate quantitative measures from the data as a comparison between sources or over time. We thought that it would be a good idea to provide an example analysis that students could walk through, so I generated two documents to guide students through (1) corpus construction and (2) analysis using news about Betsy DeVos as an example. We wanted the document to explain not only methodologically how, but how to think about the data at each stage of the analysis.
Preparing Your Corpus PDF Document
The first document about corpus construction has three parts detailing (1) what a corpus looks like on a computer, (2) how to build a corpus by downloading files from LexisNexis, and (3) how to build a corpus from an arbitrary news website by copy/pasting. I look at text files as documents, and have students build a corpus from simply copy-pasting text from downloaded LexisNexis search results or web pages. This is arguably the simplest approach to this type of analysis and also perhaps the most time consuming on a per-document basis. I think it is appropriate for teaching purposes because students won’t reach memory or speed limitations while working with the data on their personal computers, and they can become intimately familiar with the texts as a practice for using the methods.
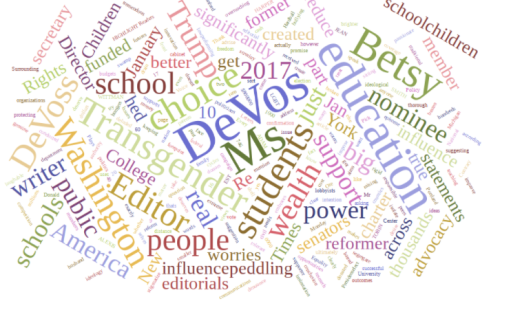
This is a document word cloud generated from https://www.jasondavies.com/wordcloud/. I encouraged students to try quickly reading through documents this way.
I then performed the analysis using some of the command line topic
modeling tools I built. The library relies on downloaded nltk corpora
for things like stopwords and requires dependencies that users likely
need to install, so I chose to simply run my code that would output a
spreadsheet for them. If interested, you can see the scripts that I used
from the command line lda.py and nmf.py. In the future, I’d like to
build semanticanalysis into an installable library that users can access
using pip. I’d also build in nltk.download() functions as
needed or maybe even switch to a different text analysis library for
that step (I’m not fond of Java on which nltk is based). In addition to
topic models, I also ran the simplest type of sentiment analysis using
word banks: I used the python empath library for this. It is essentially
a collection of topics whos contents are uniformly distributed over
manually-selected words. Among their sentiment categories are
positive_emotion and negative_emotion that I
encouraged students to use, but they could use any of the other
categories as well.
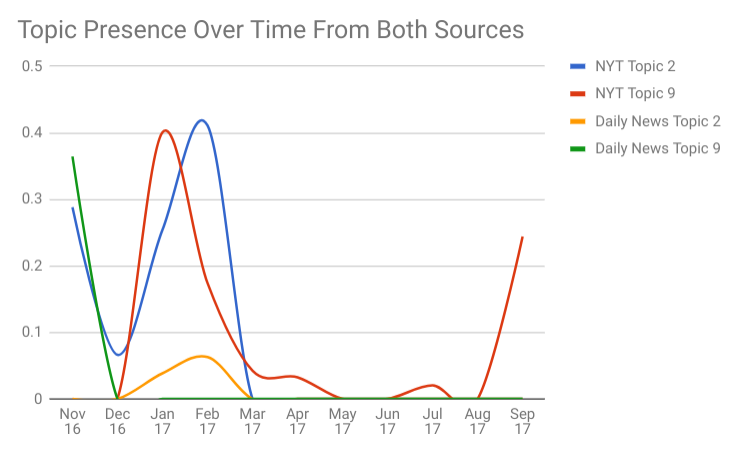
My second document details how to do different kinds of analysis using the topic model spreadsheet or sentiment analysis spreadsheets. The topic model spreadsheet contains topic content (first 20 words) on the first sheet, and a topic-document matrix on the second sheet. I then give a systematic method for interpreting each of the topics: (1) analyze the topic word contents and develop hypotheses about what each topic might be tracing through the data, then (2) sort documents by presence of that topic, and read through the first 10 or more documents to narrow or construct new hypotheses for topic representation. Topics can trace different styles, contents, or modes of discourse as they relate to different corpora and types of documents, so it is important to recognize what they mean within a specific corpus. After the topics are thoroughly examined, quantitative analysis can be performed to compare news sources, time periods, and topics or topic collections in the data. Questions like topic presence are only meaningful with appropriate interpretations, but can provide insightful results if effort is put into the process.
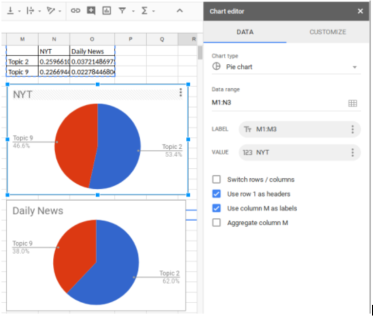
This analysis compares the relative presence of topics in each of two subcorpora. We can see that topic 9 dominates topic 2 more in the Daily News than it does in the New York Times. From the table (and other types of charts), we can also see that both topics 2 and 9 occur much more in the NYT than DN.
I would say we received a lot of variation in the effort students were willing to put into the projects. Ultimately, I’d say that most students enjoyed it, even if they were at the end still a little confused about how the process works (perhaps in part due to the fact that I generated the topic models for them). Four weeks is far too short for a proper pilot program, but the results were well worth the effort. At the very least the project had the effect of opening students’ minds as to the types of analyses that can be performed with large corpora and new questions that can be asked using these tools.
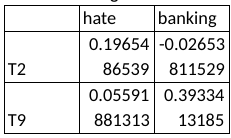
I also encouraged the interpretation of topics by calculating document correlations with some of the empath sentiment categories that are easy to interpret. This table shows that T9 might be related to banking but all other relationships seem implausible.
From my end, I think my biggest challenge is to demonstrate more thoroughly the link between theory and method: more than merely describing the weak coupling, I need to demonstrate under specific conditions and in specific contexts how and when assumptions may or may not hold to answer questions of interest. This is more difficult than a technical problem because many researchers debate today about these topics. My hope is that by continuing to teach and refine the methods we can improve how we understand the tools and contribute to the broad field of theorists and methodologists involved in these debates.