John Mohr and I recently received a grant for undergraduate
instructional development aimed at creating a tool for non-programmers
to run and analyze LDA and NMF topic models on a provided set of texts.
We chose to make this tool accessable to non-coders so that it can be
integrated into general sociology courses where most students have very
little technical experience. The tool generates topic-token and
document-topic distributions as an excel spreadsheet, allowing students
to run analyses and generate figures from within an interface they may
be familiar with. The tool uses a command-line interface and can be
installed using the command pip install easytext
(github
repo).
The command line interface is particularly focused on generating spreadsheets that students can then view and manipulate in a spreadsheet program like Excel or LibreOffice. Students can perform interpretive analysis by going between EasyText output spreadsheets and the original texts, or feed the output into a quantitative analysis program like R or Stata. The program supports features for simple word counting, noun phrase detection, Named Entity Recognition, noun-verb pair detection, entity-verb detection, prepositional phrase extraction, basic sentiment analysis, topic modeling, and the GloVe word embedding algorithm.
While there are debates about the role of topic modeling and other algorithmic approaches to text analysis requiring interpretation, our undergraduate students have shown enthusiasm and diligence in considering the limitations and strengths of such tools (see an example of a student I mentored). In many ways, their experiences with text analysis algorithms have forced them to think beyond the familiarity of p-values and confidence intervals to establish different kinds of patterns in the social world – ones that may be partially out-of-reach with classical sociological research methods. And in this process, they are forced to consider the promises and pitfalls of using these algorithms for analyses.
See the README and Command Reference pages for usage examples.
As an example use case, consider a time when you have a spreadsheet of document names and texts called “mytextdata.xls”. Let’s assume that the column name of document names is “title” and the column of texts is simply “text”. To run a topic model of this text data with 10 topics that outputs to “mytopicmodel.xls”, we would use the following command:
python -m easytext topicmodel -n 10 mytextdata.xls –doclabelcol “title” –textcol “text” mytopicmodel.xls
The topic model output spreadsheet contains four sheets:
doc_topic, topic_words,
doc_summary, and topic_summary. 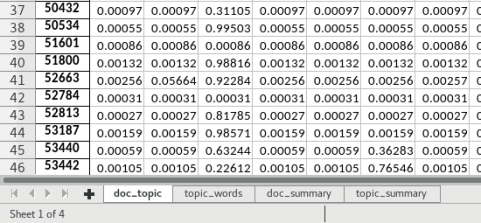
While doc_topic contains rows as documents and columns
as topic probabilities and topic_words contains topics as
words and word probabilities as columns, the doc_summary
and topic_summary sheets are meant to assist with
interpretation; the topics most closely associated with each document
and the words most closely associated with each topic, respectively.
Any topic model interpretation of course relies on referring back to the text of the original documents themselves, but this spreadsheet is designed to help with the process of linking the statistical topic model with the content and form of texts.
Further documentation is needed to push this into an instructional tool, but this is a good first step towards that end.