
Dataframe interfaces are useful because they are so flexible: filtering, mutating, selecting, and grouping functions have simple interfaces and can be chained to perform a wide range of transformations on tabular data. The cost of this flexibility, I argue, is that your data pipelines are less readable, more difficult to maintain, and more error prone. Instead, I argue that it is better to use more explicit data structures like classes or structs with fixed attributes, specific methods for construction, and specific methods for transformation/analysis.
In this article, I will contrast data frames with what I will refer to as custom data types, or data types that you define yourself as part of your data pipeline. Using custom data types means you explicitly define the structure of a particular dataset in your code before you actually attempt to use it. While I recognize that data frames have many strengths, I argue that custom data types are a better option as your projects grow and become more complex. Furthermore, I believe they will be even more important moving forward as the average developer uses more advance static analysis tools - including those based on AI.
Data Structures and Pipelines
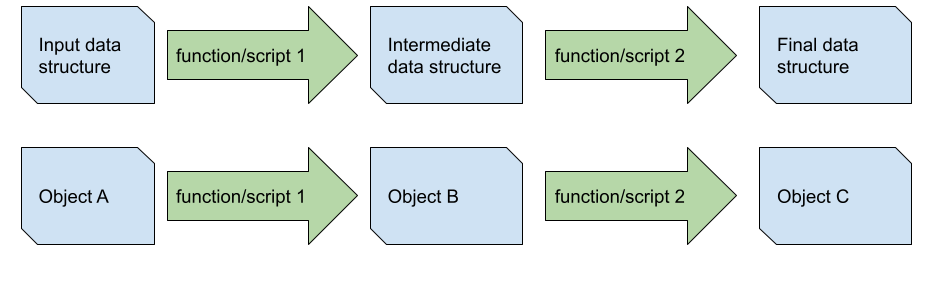
A data pipeline is a series of sequential steps for changing data from one format to another - the essential core of all data science projects. Maybe you want to visualize some variables from a CSV file in a 2-dimensional plot, produce a statistical model to capture trends of Tweets in json format, or even build a classifier to identify cats from an image training data set. In each of these cases, the data pipeline simply describes the set of transformations and intermediary representations needed to produce the final form from the given input data.
I use the term data structures to describe the intermediary representations of data in these pipelines. Essentially, this means the format in which your data is represented in your computer system and the interface (API) in your code used to access and manipulate it. In data science, data structures can refer to csv or json files on disk, array or dataframe objects, and even figures.
Features of Data Structures
I will focus on three aspects of data structures which are relevant for design patterns I will discuss. They are relevant to almost every type of data structure, and the key question is in where and how they appear in your code.
Properties or attributes. Data structures often include sets of properties, attributes, or features that are associated with a single element - the “what” of your data pipelines. These might be represented as columns in data frames where each row is an element, attributes in custom types, or as separate variables. They can be defined at instantiation (point where the structures are created) or later added, modified, or removed throughout your pipeline. The data is called immutable if it cannot be changed, and mutable otherwise.
Construction methods. Functions used to create and instantiate data structures are called construction methods. These functions are critical because they include at least some, if not all, information about which data will be contained within the structure. As such, the function signature should tell the reader (and compiler or static analyzer) a lot about what type of data is being represented. These methods can appear in your code as static factory methods, functions, or entire scripts. As an example, they may include the code used to parse json or csv data into a data object.
Transformation methods. These are the methods which actually convert your data structures from one form to the next - the “how” of your data pipelines. They may appear in your code as class methods, functions, or entire scripts. Common transformations might include filtering, summarizing, or normalizing your data. This is a more general case than construction methods, which could also be considered as transformation methods.
Next I will use these three features as comparison points.
Examples in Python
I will now compare data frames with custom data types using Python examples, although I believe these points apply to approaches and strategies in many other languages. Specifically, I will use the classic Iris datasets loaded from the seaborn package.
In Python, we can load the Iris dataset as a dataframe using the following code (note that seaborn is only used to load the data).
import seaborn
import pandas as pd

iris_df = seaborn.load_dataset("iris")
iris_df.head()
The dataframe looks like this.
sepal_length  sepal_width  petal_length  petal_width species
0           5.1          3.5           1.4          0.2  setosa
1           4.9          3.0           1.4          0.2  setosa
2           4.7          3.2           1.3          0.2  setosa
3           4.6          3.1           1.5          0.2  setosa
4           5.0          3.6           1.4          0.2  setosa
For illustrative purposes, I’ll start with a list of dictionary
objects representing irises - the most basic built-in data structures in
Python. I’ll use the DataFrame.to_dict method to accomplish
this.
iris_data = iris_df.to_dict(orient='records')The first few elements of this data will appear as the following:
[
    {
        'sepal_length': 5.1,
        'sepal_width': 3.5,
        'petal_length': 1.4,
        'petal_width': 0.2,
        'species': 'setosa'
    },
    {
        'sepal_length': 4.9,
        'sepal_width': 3.0,
        'petal_length': 1.4,
        'petal_width': 0.2,
        'species': 'setosa'
    },
    ...
]
1. Properties or Attributes of Data Structures
Data frames typically represent data attributes as columns, and each column is represented as an array of an internal type, rather than a type within the language. Python, for instance, implements int and float objects, but Pandas data frames include more specific types like 64-bit integers and floating point numbers (following NumPy arrays) that do not appear in the Python specification.
In Python, you can access columns using subscripts or (dynamically assigned) attributes.
iris_df['species']
iris_df.species
And subsets of columns in Python can be extracted using a column name list subscript.
iris_df = iris_df[['sepal_length', 'sepal_width', 'species']]The issue with these methods for selecting attributes is that you do not actually know if the columns you describe here actually exist within the data set unless you know both the initial dataset being loaded from disk and every subsequent transformation that occurs throughout your pipeline until the point where you access it. Nothing about the existence of the dataframe object guarantees the existence of those attributes, so your IDE or static analyzer do not know whether there is an error here or not, and it will not be able to provide suggestions for autocomplete.
Custom Types with Fixed Attributes
As an alternative, consider using custom data object types with a fixed set of specified attributes to represent your data. While more code is needed to create the types, the mere existence of the object comes with gaurantees about which attributes they contain. You do not need to understand the transformation used to create the object to know that the attributes will exist as part of the data object.
In most languages, I recommend creating classes or struct types to
represent your data. In Python, you can use dataclasses or
the attrs package to easily create objects that are meant
to store data. The following class represents a single Iris object.
import dataclasses

@dataclasses.dataclass
class IrisEntry:
    sepal_length: float
    sepal_width: float
    petal_length: float
    petal_width: float
    species: str
    ...
The dataclasses module creates a constructor where all these values
are required, so you may instantiate an IrisEntry like the
following:
IrisEntry(1.0, 1.0, 1.0, 1.0, 'best_species')You can then store these objects in collections, and I recommend either encapsulating those collections or at least extending an existing collection type to make the intent clearer to the reader - especially in weakly typed languages. In Python, you might extend a List using the typing module.
class Irises(typing.List[IrisEntry]):
    ...
The benefit of defining these types is that it should be obvious to any reader which properties are associated with witch types of data. If you try to access an attribute that does not exist, you will see an error from your IDE so that your static analyzer or IDE will be able to autocomplete or let you know when you make an error before you ever run your code. You are making a guarantee that every time an object like this exists, it will have these attributes.
One final note here - in more weakly typed languages like Python or R, I recommend creating immutable types, or objects that cannot be modified or extended after construction. This restriction will make for cleaner methods/functions throughout your pipeline.
2. Construction Methods
Construction methods are critical for understanding your data
pipeline because they often reveal which data the structure will
encapsulate and the operations needed to encapsulate it. As an example,
let us create a function to convert the original list of dictionaries to
a dataframe. We can do this easily using the Pandas
DataFrame.from_records method, again demonstrating the
flexibility and power of dataframe-oriented packages.
def make_iris_dataframe(iris_data: typing.List[typing.Dict[str, typing.Union[float, str]]]) -> pd.DataFrame:
    return pd.DataFrame.from_records(iris_data)
While powerful, the limitation of using such a method is that you rely on the structure of the original dataset to define its structure within your data pipeline, instead of creating a definition that the input must be placed into. To exaggerate the point, imagine you have a data pipeline where this function is the first step, and one day the data source changes the “species” attribute to be “type”. This example function would not raise any exceptions or flags, but instead propagate this data structure change further in your data pipeline such that you only know it would be broken when you try to access the column with the old name later in the pipeline. When the downstream function raises an exception, you will not immediately know whether it was because the original dataset changed or if it was an error in that first function.
The common solution to this problem is to add a standard column selection that would fail if a column has been renamed, but again it requires us to know the content of the function and also remember to build this format-checking code into any function that makes the dataframe from source data. To test whether the function worked, you will need to examine the structure of the dataframe.
def make_iris_dataframe_standardize(iris_data: typing.List[typing.Dict[str, typing.Union[float, str]]]) -> pd.DataFrame:
    df = pd.DataFrame.from_records(iris_data)
    return df[['sepal_length', 'sepal_width', 'petal_length', 'petal_width', 'species']]
A principle of good design is that your system should fail as early in the pipeline as possible so that you can isolate any issues at the point of the failure rather than to downstream functions which rely on them.
Create type-specific constructors
As an alternative, consider using a static factory method (see the
classmethod decorator in Python) on a custom type to
contain code needed to create the object from various sources. This
example shows code needed to create an IrisEntry object
from a single element of the json described before.
@dataclasses.dataclass
class IrisEntry:
    sepal_length: float
    sepal_width: float
    petal_length: float
    petal_width: float
    species: str

    @classmethod
    def from_dict(cls, entry: typing.Dict[str, float]):
        return cls(
            sepal_length = entry['sepal_length'],
            sepal_width = entry['sepal_width'],
            petal_length = entry['petal_length'],
            petal_width = entry['petal_width'],
            species = entry['species'],
        )
And the collection type could tie it together by calling the static factory method on each row of the dataframe.
class Irises(typing.List[IrisEntry]):
    @classmethod
    def from_dicts(cls, iris_data: typing.List[typing.Dict[str,float]]):
        return cls([IrisEntry.from_dict(ie) for ie in iris_data])
One could imagine creating similar static factory methods for constructing this data structure from any type of input data - not just dictionaries or data frames.
3. Transformation Methods
Methods that actually transform data from one type to another will probably make up the majority of the work in your data pipeline. Of course, regardless of the implementation and language, data frames have a wide range of standard transformation methods such as mutations, filters, and aggregations that will make up the majority of your workflows. Throughout your pipeline, you will probably at least group application-specific transformations into functions, or operations that operate on data frames with a specific set of columns and types - the iris dataframe, for instance.
Element-wise Transformations
Element-wise transformations are the simplest because they involve the transformation of each object individually. For example, let’s say you want to calculate the sepal and petal areas of each iris. The cleanest way to do this with dataframes would be to compute the areas and attach them to a new dataframe. The following function would accomplish this.
def calc_iris_area(iris_df: pd.DataFrame) -> pd.DataFrame:
    return pd.DataFrame({
        'sepal_area': iris_df['sepal_length'] * iris_df['sepal_width'],
        'petal_area': iris_df['petal_length'] * iris_df['petal_width'],
        'species': iris_df['species'],
    })
Alternatively, you could choose to modify the original dataframe in-place - this is less clean and could lead to further downstream errors, but it may be more efficient in some cases.
def calc_iris_area_inplace(iris_df: pd.DataFrame) -> pd.DataFrame:
    iris_df['sepal_area'] = iris_df['sepal_length'] * iris_df['sepal_width']
    iris_df['petal_area'] = iris_df['petal_length'] * iris_df['petal_width']
    return iris_df
You could even return a subset of the new columns as a view, which could lead to slightly less risky workflows.
    ...
    return iris_df[['sepal_area', 'petal_area', 'species']]
This again has the same risks as the constructor methods - the types alone do not really give us a sense of what the transformation will be, because both the inputs and outputs are data frames. We do not really even know if the same dataframe is being returned.
Custom types for intermediate data structures
Alternatively, try creating a new object type to represent this new intermediary step in your pipeline. You can again use static factory methods that do a little of the work needed to create the object, although more complicated logic may be better contained elsewhere.
@dataclasses.dataclass
class IrisArea:
    sepal_area: float
    petal_area: float
    species: str

    @classmethod
    def calc_from_iris(cls, iris: IrisEntry):
        return cls(
            sepal_area = iris.sepal_length * iris.sepal_width,
            petal_area = iris.petal_length * iris.petal_width,
            species = iris.species,
        )
You could even call this method back from the original
IrisEntry object if you’d like to make a simpler high-level
interface. Then you could use IrisEntry.calc_area() to
compute area instead of
IrisArea.calc_from_iris(iris_entry).
class IrisEntry:
    ...
    def calc_area(self):
        return IrisArea.calc_from_iris(self)
The collection type would simply wrap it, as shown before.
class IrisAreas(typing.List[IrisArea]):
    @classmethod
    def calc_from_irises(cls, irises: Irises):
        return IrisAreas([IrisArea.calc_from_iris(ir) for ir in irises])
To make the API easier, simply call that method from a new method in
the Irises class as we did before.
class Irises(typing.List[IrisEntry]):
    ...
    def calc_areas(self):
        return IrisAreas.calc_from_irises(self)
The interface for working with these types would look like the following:
irises = Irises.from_iris_df(iris_df)
iris_areas = irises.calc_area()
Obviously as your transformation code grows and becomes more complicated it would probably be moved outside this static factory method, but this is just a simple example of that approach.
Filtering and Aggregating
You will likely want to create transformation functions for filtering and aggregating that reference specific columns by names. These are two examples of such functions for data frames that have all the aforementioned readability problems. That said, they are very compact and somewhat easy to read.
def filter_lower_sepal_quartile(area_df: pd.DataFrame) -> pd.DataFrame:
    v = area_df['sepal_area'].quantile(0.25)
    return area_df.query(f'sepal_area > {v}')

def av_area_by_species(area_df: pd.DataFrame) -> pd.DataFrame:
    '''Average iris areas by species.'''
    return area_df.groupby('species').mean().reset_index(inplace=False, drop=False)
You would simply call these functions in sequence as part of your pipeline.
area_df = calc_iris_area(iris_df)
filtered_area_df = filter_lower_sepal_quartile(area_df)
area_by_species = av_area_by_species(filtered_area_df)
Re-use custom types in transformations
In the custom-type approach, you would attach these functions as
methods to your object classes. Notice that grouping and averaging are
combinations of two functions here, and the returned value is a mapping
from the species type to IrisArea objects (which can then
retain their own methods). This re-use of existing object types allows
you to create very flexible groupings and aggregations all from a small
set of base objects.
class IrisAreas(typing.List[IrisArea]):
    ...
    def av_area_by_species(self) -> typing.Dict[str, AverageIrisArea]:
        return {spec: areas.average() for spec, areas in self.group_by_species().items()}

    def average(self) -> AverageIrisArea:
        return IrisArea(
            sepal_area = sum([ia.sepal_area for ia in self])/len(self),
            petal_area = sum([ia.petal_area for ia in self])/len(self),
            species = self[0].species,
        )

    def group_by_species(self):
        species_areas: typing.Dict[str, IrisAreas] = dict()
        for a in self:
            species_areas.setdefault(a.species, self.__class__())
            species_areas[a.species].append(a)
        return species_areas
The high-level interface for these will just look like repeated method calls.
irises = Irises.from_iris_df(iris_df)
iris_areas = irises.calc_areas()
filtered_iris_areas = iris_areas.filter_lower_sepal_quartile()
averaged_iris_areas = filtered_iris_areas.av_area_by_species()
The value of the custom type approach here is that the reader can anticipate which kinds of groupings that are expected to be used, giving further insight into the uses of the object simply from observing that the method is part of this particular collection.
Plotting Interfaces
As a special case of these strategies, you may also want to implement plotting functions or objects as part of your pipelines. The dataframe approach is again a simple function that returns, in this case, a plotly object.
import plotly.express as px
def plot_sepal_area(areas_by_species: pd.DataFrame) -> pd.DataFrame:
    '''Plot average sepal area by species.'''
    return px.bar(areas_by_species, x='species', y='sepal_area')
Plotting Objects
When using custom types, I recommend creating an additional custom
type that contains methods for plotting this particular data in any
number of ways. This IrisAreaPlotter does a transformation
from averaged IrisArea objects into a dataframe that plotly
uses for plotting (a necessary step for any plotting method used
here).
@dataclasses.dataclass
class IrisAreaPlotter:
    iris_area_df: pd.DataFrame

    @classmethod
    def from_area_averages(cls, area_by_species: typing.Dict[str, IrisArea]):
        df = pd.DataFrame([dataclasses.asdict(a) for a in area_by_species.values()])
        return cls(df)

    def bar(self):
        return px.bar(self.iris_area_df, x='species', y='sepal_area')
You’d access those methods using the static factory method of the plotter object and calling the relevant plotting function.
iris_plotter = IrisAreaPlotter.from_area_averages(averaged_iris_areas)
iris_plotter.bar()
Alternatively, following the strategy in the previous example, you
could access it using averaged_iris_areas.plot.bar() or
something similar.
Where the strength of working with data frames is that you can produce compact code by taking advantage of powerful methods built into existing packages, the weakness is that your pipeline will be more difficult to refactor or extend later. Furthermore, your IDE assistants (including AI-based solutions) will not be able to identify issues until you actually run your code.
Pipeline View
Finally, it is worth considering these two data pipelines on a theoretical level. First consider the pipeline that involves data frames which I visualized below. Notice that every intermediary stage in this pipeline takes a dataframe as input and outputs a dataframe, so it is difficult to tell the structure of the data without either checking it at runtime or remembering the expected structure of the input data and reading through the body - a task that becomes difficult as your project grows.
List[Dict[str, float]]
    make_iris_dataframe -> pd.DataFrame
    calc_iris_area -> pd.DataFrame
    filter_lower_sepal_quartile -> pd.DataFrame
    av_area_by_species -> pd.DataFrame
    plot_sepal_area -> plotly.Plot
In contrast, the custom data type approach easily allows us to
understand the structure that this data takes at each point in the
pipeline. For instance, we know that at some point in our pipeline, the
relevant data can be represented simply as a set of
IrisAreas objects, and from the definition we know what we
expect to be the types of the data in those positions.
List[Dict[str, float]]
    Irises.from_dicts -> Irises (List[IrisEntry])
    .calc_areas -> IrisAreas (List[IrisArea])
    .filter_lower_sepal_quartile -> IrisAreas (List[IrisArea])
    .av_area_by_species -> Dict[str, IrisArea]
    .plot.bar -> plotly.Plot
More readable: the reader can identify the structure of the data at any point in the pipeline simply by looking at the data types (with type hints), regardless of whether they know the structure of the original data.
Easier to maintain: the data scientist could replace or modify sections of the pipeline without needing to examine transformations that occur before or after, since the structure of the data will remain the same as long as the expected types are the same.
Less error prone: smart static analyzers (including AI-assisted ones) can identify issues with accessing attributes and the structure of your data before you ever run it because defined data types provide guarantees about which attributes your data should contain.
Even though dataframe structures (especially those written in weakly typed languages such as R or Python) offer great flexibility in the way you can build your pipeline, building more structure into your code through the use of custom types can greatly improve your ability to manage data science projects.
.
Appendix: Full Code Examples
These are the full code snippets for convenience.
Dataframe Approach
def make_iris_dataframe(iris_data: typing.List[typing.Dict[str, typing.Union[float, str]]]) -> pd.DataFrame:
    df = pd.DataFrame.from_records(iris_data)
    return df[['sepal_length', 'sepal_width', 'petal_length', 'petal_width', 'species']]

def calc_iris_area(iris_df: pd.DataFrame) -> pd.DataFrame:
    '''Multiplies length and width of sepal and petals of each iris.'''
    return pd.DataFrame({
        'sepal_area': iris_df['sepal_length'] * iris_df['sepal_width'],
        'petal_area': iris_df['petal_length'] * iris_df['petal_width'],
        'species': iris_df['species'],
    })

def calc_iris_area_inplace(iris_df: pd.DataFrame) -> pd.DataFrame:
    '''Multiplies length and width of sepal and petals of each iris.'''
    return pd.DataFrame({
        'sepal_area': iris_df['sepal_length'] * iris_df['sepal_width'],
        'petal_area': iris_df['petal_length'] * iris_df['petal_width'],
        'species': iris_df['species'],
    })

def filter_lower_sepal_quartile(area_df: pd.DataFrame) -> pd.DataFrame:
    v = area_df['sepal_area'].quantile(0.25)
    return area_df.query(f'sepal_area > {v}')

def av_area_by_species(area_df: pd.DataFrame) -> pd.DataFrame:
    '''Average iris areas by species.'''
    return area_df.groupby('species').mean().reset_index(inplace=False, drop=False)

import plotly.express as px
def plot_sepal_area(areas_by_species: pd.DataFrame) -> pd.DataFrame:
    '''Plot average sepal area by species.'''
    return px.bar(areas_by_species, x='species', y='sepal_area')

iris_df = make_iris_dataframe(iris_data)
area_df = calc_iris_area(iris_df)
filtered_area_df = filter_lower_sepal_quartile(area_df)
area_by_species = av_area_by_species(filtered_area_df)
plot_sepal_area(area_by_species)
Custom Type Approach
import dataclasses

@dataclasses.dataclass
class IrisEntry:
    sepal_length: float
    sepal_width: float
    petal_length: float
    petal_width: float
    species: str

    @classmethod
    def from_dict(cls, entry: typing.Dict[str, float]):
        return cls(
            sepal_length = entry['sepal_length'],
            sepal_width = entry['sepal_width'],
            petal_length = entry['petal_length'],
            petal_width = entry['petal_width'],
            species = entry['species'],
        )

    def calc_area(self):
        return IrisArea.calc_from_iris(self)

class Irises(typing.List[IrisEntry]):

    @classmethod
    def from_dicts(cls, iris_data: typing.List[typing.Dict[str,float]]):
        return cls([IrisEntry.from_dict(ie) for ie in iris_data])

    def calc_areas(self):
        return IrisAreas.calc_from_irises(self)

@dataclasses.dataclass
class IrisArea:
    sepal_area: float
    petal_area: float
    species: str

    @classmethod
    def calc_from_iris(cls, iris: IrisEntry):
        return cls(
            sepal_area = iris.sepal_length * iris.sepal_width,
            petal_area = iris.petal_length * iris.petal_width,
            species = iris.species,
        )

class IrisAreas(typing.List[IrisArea]):
    @classmethod
    def calc_from_irises(cls, irises: Irises):
        return IrisAreas([IrisArea.calc_from_iris(ir) for ir in irises])

    def filter_lower_sepal_quartile(self):
        v = list(sorted([ia.sepal_area for ia in self]))[len(self)//4]
        return self.__class__([ia for ia in self if ia.sepal_area > v])

    def av_area_by_species(self) -> typing.Dict[str, IrisArea]:
        return {spec: areas.average() for spec, areas in self.group_by_species().items()}

    def average(self) -> IrisArea:
        return IrisArea(
            sepal_area = sum([ia.sepal_area for ia in self])/len(self),
            petal_area = sum([ia.petal_area for ia in self])/len(self),
            species = self[0].species,
        )

    def group_by_species(self):
        species_areas: typing.Dict[str, IrisAreas] = dict()
        for a in self:
            species_areas.setdefault(a.species, self.__class__())
            species_areas[a.species].append(a)
        return species_areas

    def plot(self):
        return IrisAreaPlotter.from_area_averages(self.average_by_species())


@dataclasses.dataclass
class IrisAreaPlotter:
    iris_area_df: pd.DataFrame

    @classmethod
    def from_area_averages(cls, area_by_species: typing.Dict[str, IrisArea]):
        df = pd.DataFrame([dataclasses.asdict(a) for a in area_by_species.values()])
        return cls(df)

    def bar(self):
        return px.bar(self.iris_area_df, x='species', y='sepal_area')

irises = Irises.from_dicts(iris_data)
iris_areas = irises.calc_areas()
filtered_iris_areas = iris_areas.filter_lower_sepal_quartile()
averaged_iris_areas = filtered_iris_areas.av_area_by_species()
iris_plotter = IrisAreaPlotter.from_area_averages(averaged_iris_areas)
iris_plotter.bar()